
From 75% to 91% OEE in 6 Months
Using state-of-the-art CNC machines, Nobel Biocare produces precision machined components that are designed to last a lifetime. By improving response time to downtime, mostly from losses due to waiting, they increased output by 16% to $200K per month.
The Challenge
In response to strong demand, Nobel needed to seize the opportunity to increase output using their existing machines and people. From the data they had, they knew OEE was around 75%, but the specifics of “why” were elusive. They needed clarity on what was causing production downtime and a precise way to initiate improvements.
Nobel chose Raven to support their continuous improvement efforts by helping them to take action to address their biggest losses. The first step was to instrument 60 CNC machines with Raven tablets to capture data from their machines, operators and ERP. The Raven platform combines, cleans and interprets this data in real-time to capture what is actually happening on their shop floor. This new information allowed Nobel’s production team to address problems as they happened and to choose projects that address their biggest source of systemic losses.
Implementation Process
Over two days, Raven tablets were installed on 60 of the company’s CNC machines capturing on/off and count signals directly from the machine’s PLCs. The tablets were configured with an initial set of downtime tags that allowed operators to quickly and easily indicate the reason for downtime. To minimize operator burden and increase engagement, initially only a small number of downtime tags were selected. The information from these tags is critical to be able to different between production, planned downtime, and unplanned downtime.
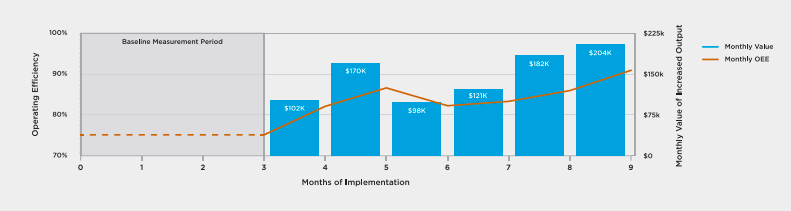
The first three months data established baseline performance. In the spirit of lean manufacturing, the focus was on continuous improvement. To help create a high degree of engagement from the production operators in particular, the machine operators were encouraged to be active participants in the configuration of the system as well as regular users of the information produced. It was also very important that production support and leadership showed their commitment to data enabled continuous improvement and this was done by integrating the new accurate data generated by the Raven system into their daily management process, including at their daily huddle and Gemba walks.
With a high level of engagment from production staff, strong support from leadership and a complete and accurate data describing performance, all the pieces were in place to begin to aggressively drive gains. The baseline established during the on-boarding phase of implementation helped to clearly demostrate the impact of their efforts.
 The impact
Improved Up-time
Nine months after Raven units were installed, and six months after improvements began, operating efficiency (Overall Equipment Efficiency: OEE) for the 60 machines had increased from 75% to 91%. This level of improvement was unprecedented and far exceeded internal goals to increase by 6%.
Increased Production Output
Reduced unwanted downtime resulted in a direct increase in product output. Each machine was estimated to produce $100 of value per hour. Output improved during the six months after baseline, to $204K of incremental monthly production. That projects to an incremental $2.45 million for the value of additional production over the next 12 months.
Reduced Unplanned Downtime
Unplanned downtime across the line reduced from over 1,500 hours per month during the baseline period to under 100 hours in the sixth month of improvements. The largest portion of observed time lost was in waiting: for maintenance, for programming, for materials shortages, or for operators to restart production after downtime. Refined tagging identified the sources of waiting, and process improvements were made for each. For example, waiting for maintenance and programming was reduced from 466 hours to just 33 hours.
Once it is possible to reliably identify unwanted downtime in real-time, the process to address it is relatively straightforward. For “waiting” losses, the most effective way to trigger action is with alerts. To keep the production staff engaged and responsive to these alerts it is critical that they receive a small number of alerts and the are also provided feedback showing the impact of their efforts to respond to alerts.
Reduced Planned Downtime
The process improvements, which were applied to deploy resources more efficiently for unplanned downtime, resulted in improvements in planned downtime as well. Planned downtime for activities such as setup, tool change, and production change-overs was reduced from 793 to 577 hours per month.
Hawthorne Effect Improvements
From the time Raven was installed, the tablet’s red screens alerted operators to downtime, immediately improving response times. Likewise, the big-screen team displays showing the status of all 60 machines prompted supervisors to respond to material shortages or maintenance needs faster. This suggests the baseline measurement was an improvement from productivity before Raven was installed due to the Hawthorne effect (the awareness of measuring having an effect on measurement).
Improved Best Practices
Using Raven’s analytics platform and customized monthly reports, the production teams were able to identify which shifts and operators were consistently top performers. Team members with exceptional performance were interviewed, and their best practices were integrated into standard operating procedures to help others benefit from their process innovations.
The 3E’s of continuous improvement
For Nobel and all manufacturers, the keys to digital continuous improvement are always the same:
- Establish the facts by capturing, cleaning and interpreting your operational data
- Empower your teams to take actions to improve with clear and timely guidance
- Engage your team with personalized and actionable feedback
This process was utilize by Nobel prior to implementation of Raven’s digital continuous improvement platform, however real-time access to accurate insights from all their data allowed them to spend time coming up with innovative ways to improve rather than manually searching through historical data for insights.
Based on the value of increased production, the company’s return on investment in the first year was 24:1 and is projected at 50:1 for subsequent years.

